Introduction
Monitoring Memcached through hit rate, evicitions sometime is not enough to find what is really happening.
Maatkit have released a Perl toolkit for MySQL and PosteGreSQL, but one tool on this toolkit can also profile Memcached traffic.
This article will focus on mk-query-digest, the Memcached traffic profiler.
Dumping tcp traffic with tcpdump
Before running tcpdump, be aware that it take ~35% load of a one vCPU server here and the output file increase in size at a rate of 300 MB / min, but this may vary, depending on your cached data and requests rate.
You can also tcpdump directly from cache server to get all requests issued to this server, or from an Apache server (In case you only get memcached request asked by this particular server).
Installation
To start profiling we first have to capture memcached network traffic with tcpdump, in case you don't have it installed, you can grab it from www.tcpdump.org or using your system installation prefered method.
Using tcpdump
To start the tcpdump, use the command below :
/usr/sbin/tcpdump -s 65535 -x -n -q -tttt -i eth0 port 11211 > /tmp/tcpdump.log
For more information about tcpdump filters, take a look at this documentation
Server will respond if everything is fine :
tcpdump: verbose output suppressed, use -v or -vv for full protocol decode
listening on eth0, link-type EN10MB (Ethernet), capture size 65535 bytes*
To stop tcpdump, hit CTRL + C, result will show like this :
599513 packets captured
607766 packets received by filter
8244 packets dropped by kernel
And were done with the tcpdump.
Let's profile !
Memcached profiling
Although mk-query-digest is designed to be as efficient as possible, it can use a lot of CPU and memory, so I prefer to move log output on our log analysis server.
After log file is moved, we can install mk-query-digest.
Download the latest release of mk-query-digest
Simply execute
wget http://www.maatkit.org/get/mk-query-digest
or
wget http://maatkit.googlecode.com/svn/trunk/mk-query-digest/mk-query-digest
We also need to enable execution of this perl script
chmod 0777 mk-query-digest
Profiling with mk-query-digest
Then we can start profiling with the help of http://www.maatkit.org/doc/mk-query-digest.html
During profiling, mk-query-digest will inform us that it is always running (A nice addition of a recent release)
dump_merlie.log:  28% 01:14 remain
dump_merlie.log:  57% 00:45 remain
dump_merlie.log:  85% 00:14 remain
Note that if you CTRL + C before the end, mk-query-digest will also put display the results of data he has already computed
Results by Memcached server response code
First command is to show all memcached response code from tcpdump
./mk-query-digest --type memcached --group-by res --limit 10 /tmp/tcpdump.log
After some time result will be displayed.

What it tell us :
General & time stats

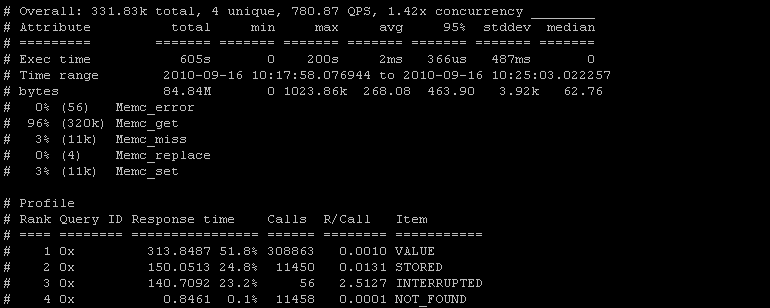
First line show us that during 331.83k memcached queries, there was 4 unique results for the --group-by res (VALUE, INTERRUPTED, NOT_FOUND, STORED), and that during the time interval it was issued 780.87 query per second with a 1.42x concurrency.
Lines below show us time taken to respond to theses commands (min, max, avg, 95%, ...)
Commands, miss & errors

Finally, we see what commands were issued to memcached, and what errors takes place (that is why % sum are above 100%) but we have to distingish two set of datas :
Memc_get tell us logically that 96% of 331K commands where get, 3% were set commands, and 4 commands where replace, this finally lead us to 100%
Memc_miss is for any command that result in a NOT_FOUND, in this case, 3% of all command tried to access to a nonexistent key.
Memc_error refers to retrieval (gets) commands that were INTERRUPTED, 56 of the 308K gets were in this case.
Memcached results

The columns should be fairly self-explanatory: rank, query ID (Not in use here), response time sum and percentage of total, number of calls and response time per call, and results (asked by our --group-by res)
First observation
As we can deduce from above screen, it seems that this server have a pretty good hit ratio (Only 3% miss) and every NOT_FOUND seems to be followed by a STORED (A miss in a get command followed by a set), and everything is fast.
But we found 56 INTERRUPTED (0.0001%) that takes alone 24.8% of the time taken to execute 270K commands.
Next we have to find what is wrong with these 0.0001% of total command that goes INTERRUPTED.
Following results : VALUE result
After this summary, every result is detailed, first the VALUE result

Let's see what each part say :
General & time stats

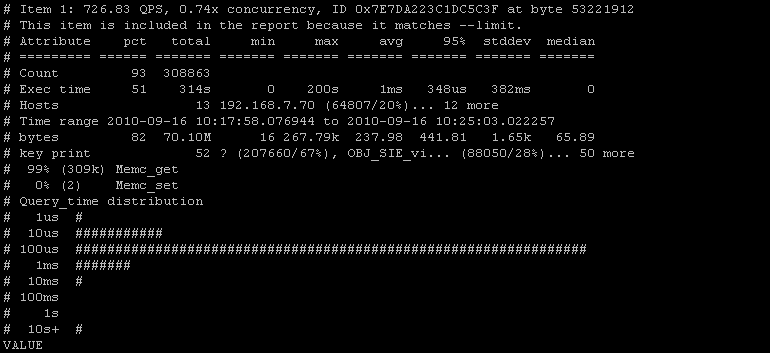
This part is similar to the general time & stats screen, you've got here time stats (total, max, avg, 95%, ...), hosts that asked for values with percent repartition, size of return values (total, max, avg, ...), and distribution of commands (I think the two set commands is a misread by mk-query-digest)
Query time distribution

This is particulary interesting logarithmic chart of time clustering, it show distribution of time of requests execution. As we see, most of them are under 100us, and a small part of them are a bit slow.
You have to check this charts, high response time must be avoid.
Looking a overall stats, it seem one request take 200s to execute, it can be a lot of things, client closing connection, network problem, in my case, 314s total - 200s max = 114 s to execute and send 308K get request seem to be pretty good, i will not investigate this more, but will watch it regulary.
I will make another profiling to see what's happening after explaining INTERRUPTED.
INTERRUPTED

Time chart show that INTERRUPTED requests take lot of time, that one object is 1023.86kBytes (limit is 1024), but key print can't show us if one particular key is the cause.
So we have to change our mk-query-digest parameters to investigate further
Memcached result INTERRUPTED, grouped by keys
What I want is to see what key retreival were interrupted, to see if a particular key is broken or something similar.
Building the mk-query-digest query
Mk-query-digest support PERL regular expressions and give acces to EventAttributes (see this documentation).
Do not hesistate to test your own commands, if something is wrong, mk-query-digest will tell it when you launch it.
So with some tweak, we now have a request that will ask to only show INTERRUPTED events grouped by key to find what iis messed up.
./mk-query-digest --type memcached --group-by key  --limit 10 --filter
                  '($event->{res}) =~ m/INTERRUPTED/' /tmp/tcpdump.log
Result

We now see that one particular key take 116 sec, the others are bellow 1 sec.
By using phpMemcachedAdmin, to make a get request with theses key, nothing seemed wrong, values were returned very quickly, so my first clue about connection closed seems right.
Another thing i note is that using hash for memcached key is a good idea, but our developers need to put some ID before, like projectA_aee2ff ...., because looking a theses key, i can't see what it refers to.
Looking for big return values
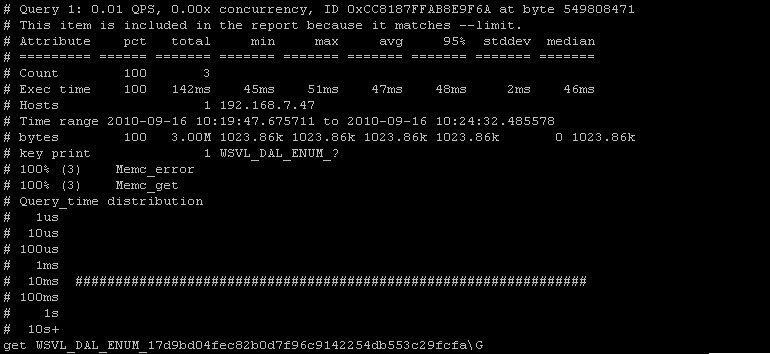
We can also look for response time of big values, or find values that will go beyond the 1MBytes Memcached limit.
./mk-query-digest --type memcached --group-by fingerprint  --limit 10 --filter
                  '($event->{bytes}) >= 1_000_000'  /tmp/tcpdump.log
Results
I only get one result for this particular request

This key is exactly at the Memcached maximum object size, and must be watched and/or reduced in size.
Useful Options
--save-results
Save results to the specified file.
--timeline
Show a timeline of events.
./mk-query-digest --type memcached --timeline --group-by res /tmp/tcpdump.log

--watch-server
This option tells mk-query-digest which server IP address and port (like "10.0.0.1:3306") to watch when parsing tcpdump
Resources
Tcpdump homepage : www.tcpdump.org
Tcpdump filters explanation : http://www.cs.ucr.edu/~marios/ethereal-tcpdump.pdf
Maatkit homepage : http://www.maatkit.org/
Mk-query-digest homepage : http://www.maatkit.org/doc/mk-query-digest.html
Other Memcached Resources
You can find a lot of Memcached resources on this Memcached resources page.